
Plus500 tutorial: learn how to trade successfully
- 10 Domain Investment Tips for Beginners - August 31, 2020
- Reasons Why 7 Out of 10 Businesses Fail Within 10 Years - August 30, 2020
- Secrets to success from 10 of the world’s richest entrepreneurs - August 30, 2020
In this article you will learn how to trade using the Plus500 platform. We will teach you how the Plus500 software works and you will discover how you can open your first trade. After that, we will teach you important information that you can use to make your investment decisions.
How do you open an account at Plus500?
In this tutorial we use the Plus500 software as an example. Plus500 is one of the best brokers, especially if you want to actively trade the markets. When you sign up with Plus500 as a new trader, you receive a free demo of $40.000! By using the demo you can experience the possibilities of trading without risk. You can practice as long as you like with the demo functionality. What are the biggest advantages of the Plus500 platform?
- Unlimited & free practice with a demo
- Trade in all the popular CFD stocks
- Open an accountwithin 3 minutes
Do you want to open an account with Plus500? Press the button to open a free & risk free demo account:
PLUS500 REGISTER

By pressing the button you can immediately open your free demo. 76.4% of retail investors lose money when trading CFD’s with this provider.
Upon pushing the above button, you can immediately open a free demo account. The only thing you need to open a free demo account are a valid mail address and a password. Another option is to log in via your Facbook or Google account.
Part 1: Plus500 software
This tutorial will teach you how to use the Plus500 online software, allowing you to immediately open and close trades. In this Plus500 manual we discuss several aspects related to investing at Plus500
Plus500: the software explained
The Plus500 software is very user-friendly. At the top you can immediately search for the CFD stock you want to trade. The top bar also indicates the available balance on your account. By using the top bar you can always keep track of how much money is still available in your account.

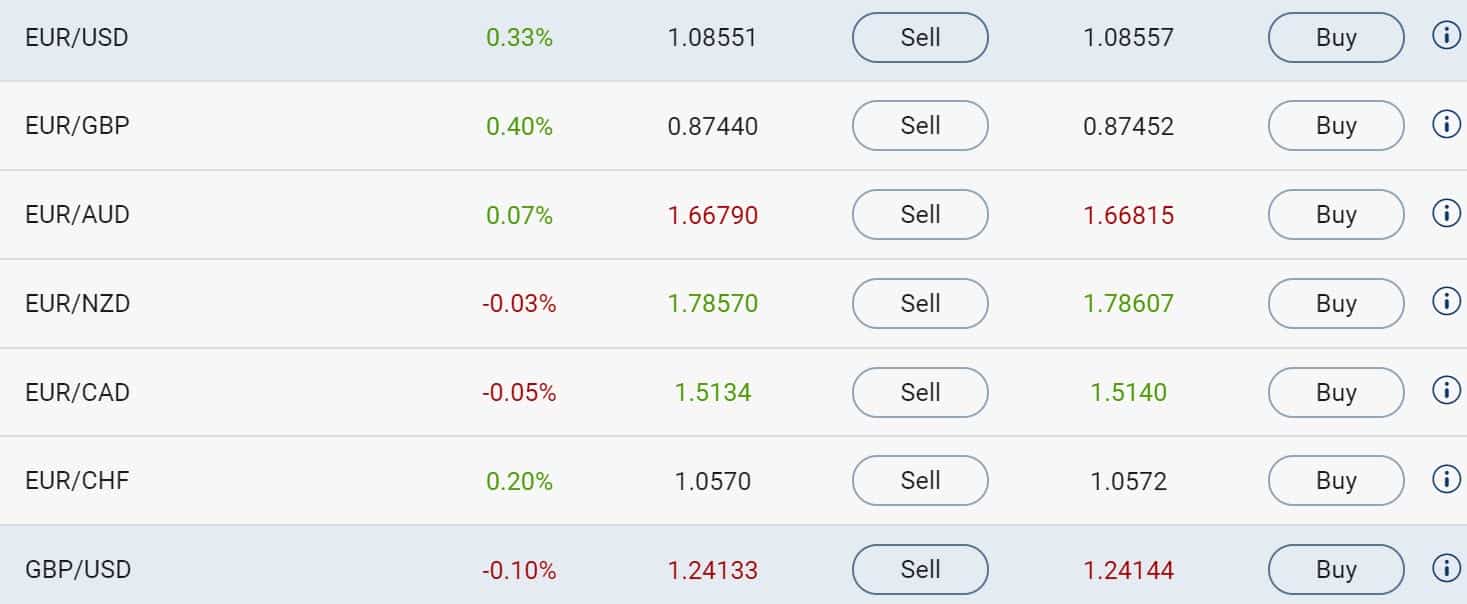
The middle screen will show you a clear overview of the prices of different stocks. You can browse to this screen to consult the buy and sell prices of the stocks you are interested in. A simple push on a button will also allow you to place an order. You can search for a stock in a certain category. The example shows you all currencies in the Forex category.
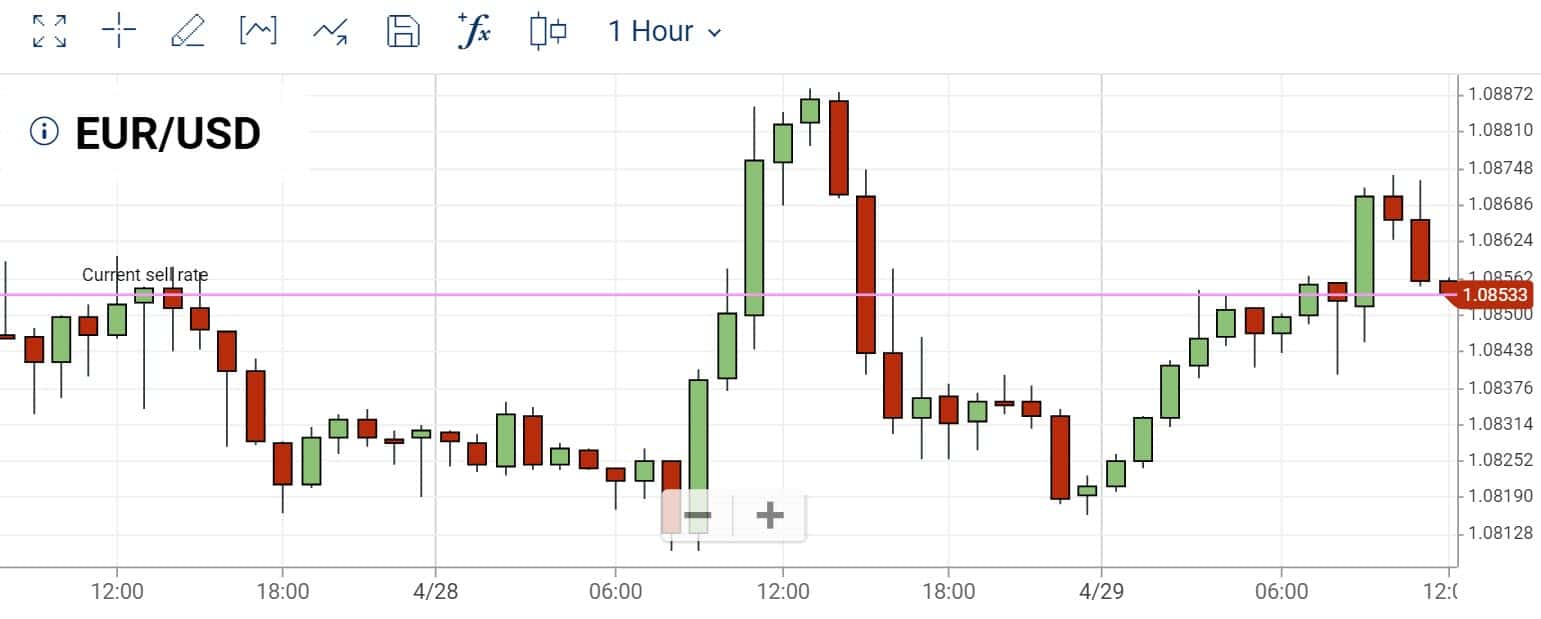
At the bottom of the software you find the graph of the CFD you have selected. The graph shows you the price fluctuation over various periods of time. You can also conduct your own analyses on the graph by using technical indicators.
How do you open a position?
When you want to trade with Plus500, you can for example open a position on a stock or a commodity When you open a position you always have two options. By buying, you speculate on a price increase. This makes it possible to profit in economically good and bad times!

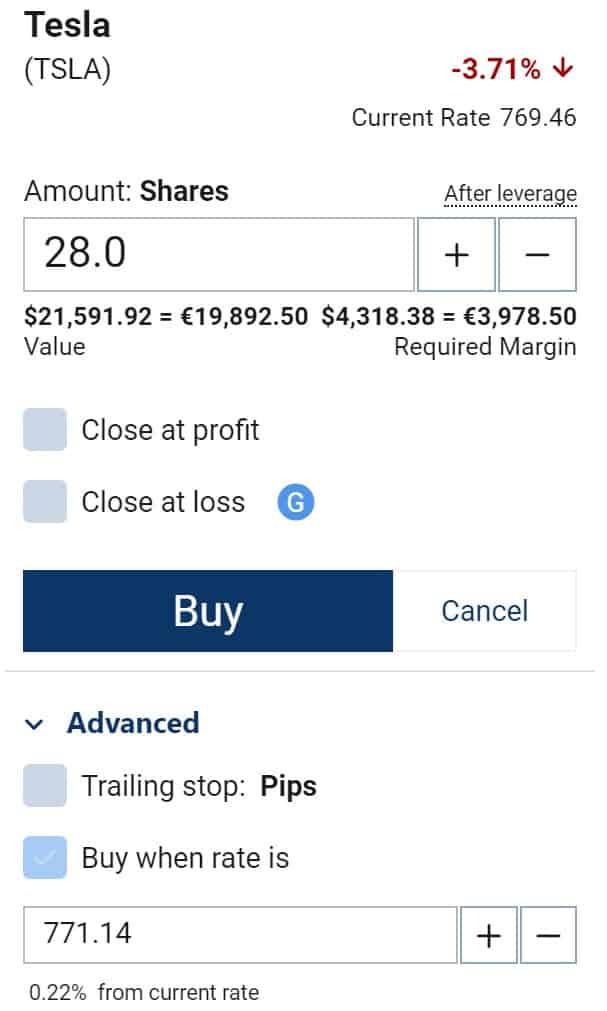
Upon clicking the buying or selling button, the order window will pop up. You can use the order window to indicate how many CFD stocks you would like to trade. Upon clicking the buying button, your position will immediately open. You can also make use of an order. By selecting the option ‘buy when rate is’, you can indicate at which price you would like to automatically open a trade.
One general advice: always make use of a stop loss. This is the level at which you automatically take your loss. By selecting ‘close at loss’, you can make use of this useful feature. You can also opt to automatically close a position when achieving a certain return on investment.
Another functionality is the trailing-stop. A trailing-stop is set, when you want to make sure your profit automatically moves along with a possible stock price increase. This way you will not only grab the maximum profit, but you will also secure your profit.
Before investing at Plus500, it is recommended to read the additional information. The additional information tells you the minimum number of units you have to invest in. You can for example trade a minimum of 0,5 CFD Tesla stocks in the below example.
You will also find the leverage you can apply. Using a 1:5 leverage, you will only have to invest 20% of the entire amount yourself. A 1:5 leverage means you invest $100 to trade $500. Nevertheless, be aware this not only means a significant profit increase but in some cases also a significant loss increase. Does the price rise by $1? In that case your profit will immediately be $5. On the other hand, does the price fall by $1? In that case you will lose $5. This article will tell you more about investing with a leverage.
Moreover, there is also the spread. The spread is in fact your transaction costs. Some CFD’s charge a fixed spread. Other CFD’s charge a dynamic spread. When dealing with a dynamic spread, it is of crucial importance to keep a close eye on the transaction costs to ensure they remain at an acceptable level.
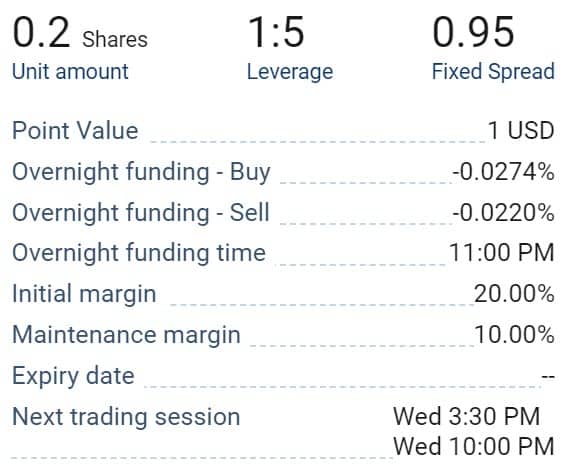
Each CFD still has other information which is displayed: the base currency, the overnight financing fee, margin requirements, expiration date and trade sessions. Let us briefly look at those concepts.
Base currency
This is the currency against which the CFD is traded. For example, American stocks are traded in dollars.
Overnight financing fee
The overnight financing fee is a fee you are charged when you keep your position open upon closure of the stock exchange. The fee time is the time at which the fee will be charged. Do you still have your position at that moment? In that case you will be charged additional costs.
The overnight financing fee – buy is calculated upon buying your stock and the fee – sell is calculated upon selling your stock.
Margin requirements
The initial margin indicates which amount you must have on your account to open a position. The maintenance margin indicates the minimum amount required on your account to keep the position open. In this case the margin is 10%.
Practically this means, you must have at least $100 on your account if you would like to trade $1000 of CFD stocks. Do you not meet the minimum amount? In that case you will have to deposit extra money. If you don’t deposit additional money, your position will automatically be closed. This is also known as a margin call.
Expiration date
Please be aware some CFD’s have an expiration date. When a CFD expires, it will automatically close at that particular moment in time and it doesn’t matter if you hold a winning or losing position. These expiration dates often apply to CFD’s on cryptocurrencies.
Trade session
A trade session is a period of time during which you can trade the stock.
Managing positions & orders
The left menu bar of the software is the place where you manage all your trades. The open positions menu shows you all open trades. The orders menu will tell you which orders you have placed. The closed positions menu displays all results you have achieved through your investments.
Open positions will show you a real-time view of your position’s performance. Only upon closing a position, the result becomes final. Your profit or loss will then be added to or deducted from your balance.
It is recommended to create a clear plan before opening your position. Don’t make adjustments to your running investments. It’s the only way to ensure you keep on trading rationally. Emotions gaining the upper hand… it’s unfortunately a behaviour many investors get confronted with.
Manage your risks at Plus500
When you open a position, you can use the stop loss and take profit functionalities. With a stop loss you can determine the moment when you automatically take your loss. With a take profit you can determine the moment when you automatically take your profits. Always use the stop loss function, so you don’t need to watch your position constantly and so you will always know how much you can maximally lose on one trade!
When you want to trade profitably, it is clever to set the take profit twice as high as your stop loss. When you want to lose a maximum of $10 on a position and you would potentially earn $20, you only need to make the right decision in 50 percent of the cases. Dealing with risks is essential when you want to make money by trading.
Let us further clarify and explain this by means of a fictitious investment. Suppose you want to open a position on a $10 stock. You have done the required analysis and expect a possible price increase up to $15. You don’t expect to lose more than $2,50 on the position and therefore a $2,50 loss is set as your stop loss. This would be an investment with a favourable risk-return on investment ratio.
Deposit & withdraw money at Plus500
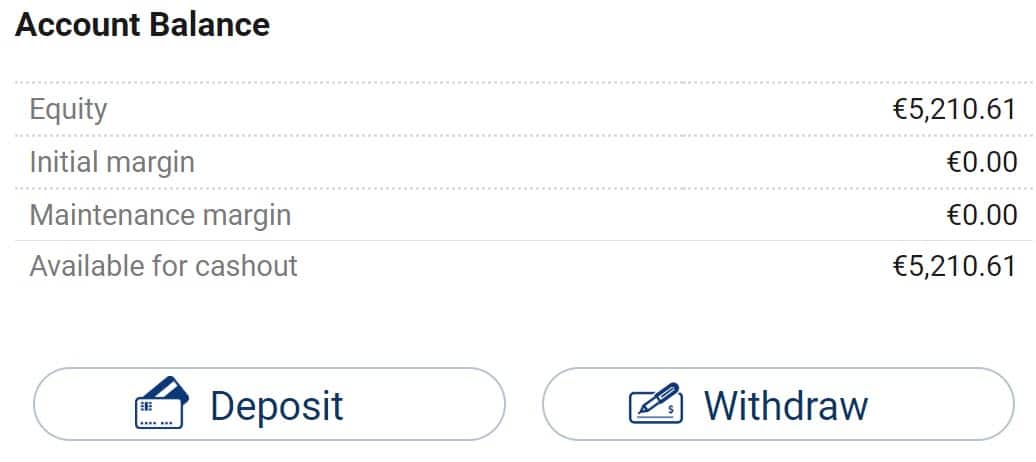
Before you can start trading with real money, you will have to make a first deposit at Plus500. As little as $100 is minimally required to start trading at Plus500. Before you can deposit money you will have to verify your identity. This is a legal requirement for anyone who wants to open an investment account. Fortunately, you only have to do this once.
Withdrawing money is child’s play. To withdraw your money, you just click the withdrawal button. A few business days later, your profit will have been deposited on your account!
Some general Plus500 tips
- Deposit a small amount to get used to trading with real money.
- Practice and keep track of what works and what doesn’t; learn from your mistakes.
- Always use a stop loss so that you can’t lose more than X% of your account.
- Don’t put too much money into one trade; only risk a modest percentage.
Part 2: how does the stock market work?
In the second part of the Plus500 tutorial we discuss the ins and outs of the stock market. It’s important to get a good understanding of the stock market and the way prices are set. This way you will also get a better understanding of how to benefit from the Plus500 possibilities.
The game of demand and supply
The price of each CFD within the Plus500 software is the result of the game of demand and supply. When an increasing number of people want to buy a certain stock, the price will increase too. If on the other hand, everyone wants to get rid of the stock and no one is interested in the stock anymore, the price will probably fall.
Becoming a successful investor is therefore not about outperforming the market but only matching it and behaving like the average investor. Try to think like the average Joe.
Responding to the news
Investing is a psychological game. An individual is hard to read. It is way easier to predict group behaviour than to predict individual behaviour. When you decide to invest, it is recommended to think like the average Joe.
It is crucial to remember investors do not take the rational path. The value of a stock doesn’t automatically determine the value of the underlying company. Humans are like sheep and try to be part of the herd. When bad news is published, the stock prices can therefore dramatically fall in the blink of an eye.
A perfect example is the coronavirus pandemic which occurred in 2020. The virus resulted into a global lockdown. Many companies can’t continue their services and sales during a lockdown. Another consequence was the fact people started to sell their stocks en masse. The stock prices dramatically fell.
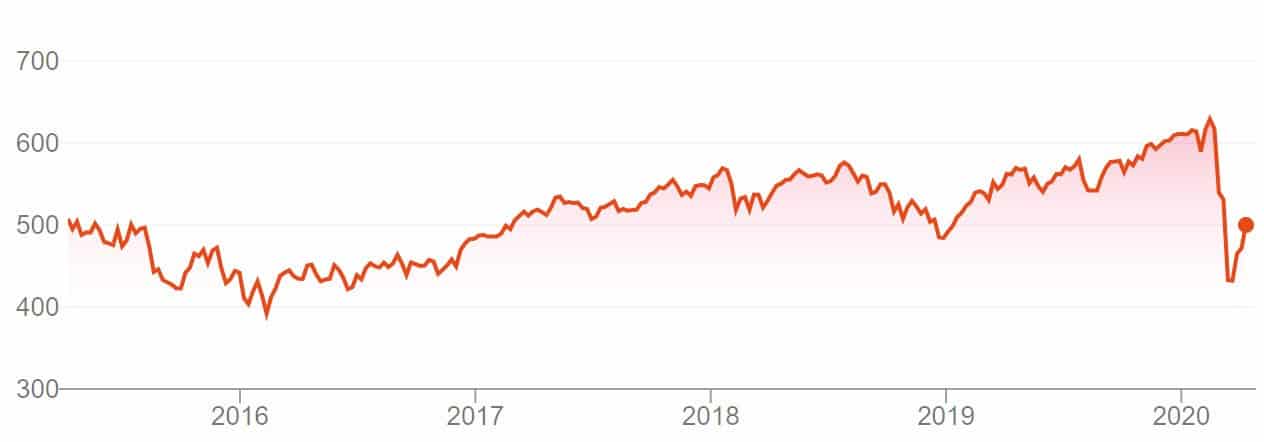
When negative news hits the road, a smart investor responds properly. Remember people often start selling stocks in a panic and negative news can have a dramatic effect on the stock prices. This way, you can predict the probable fall of the stock prices.
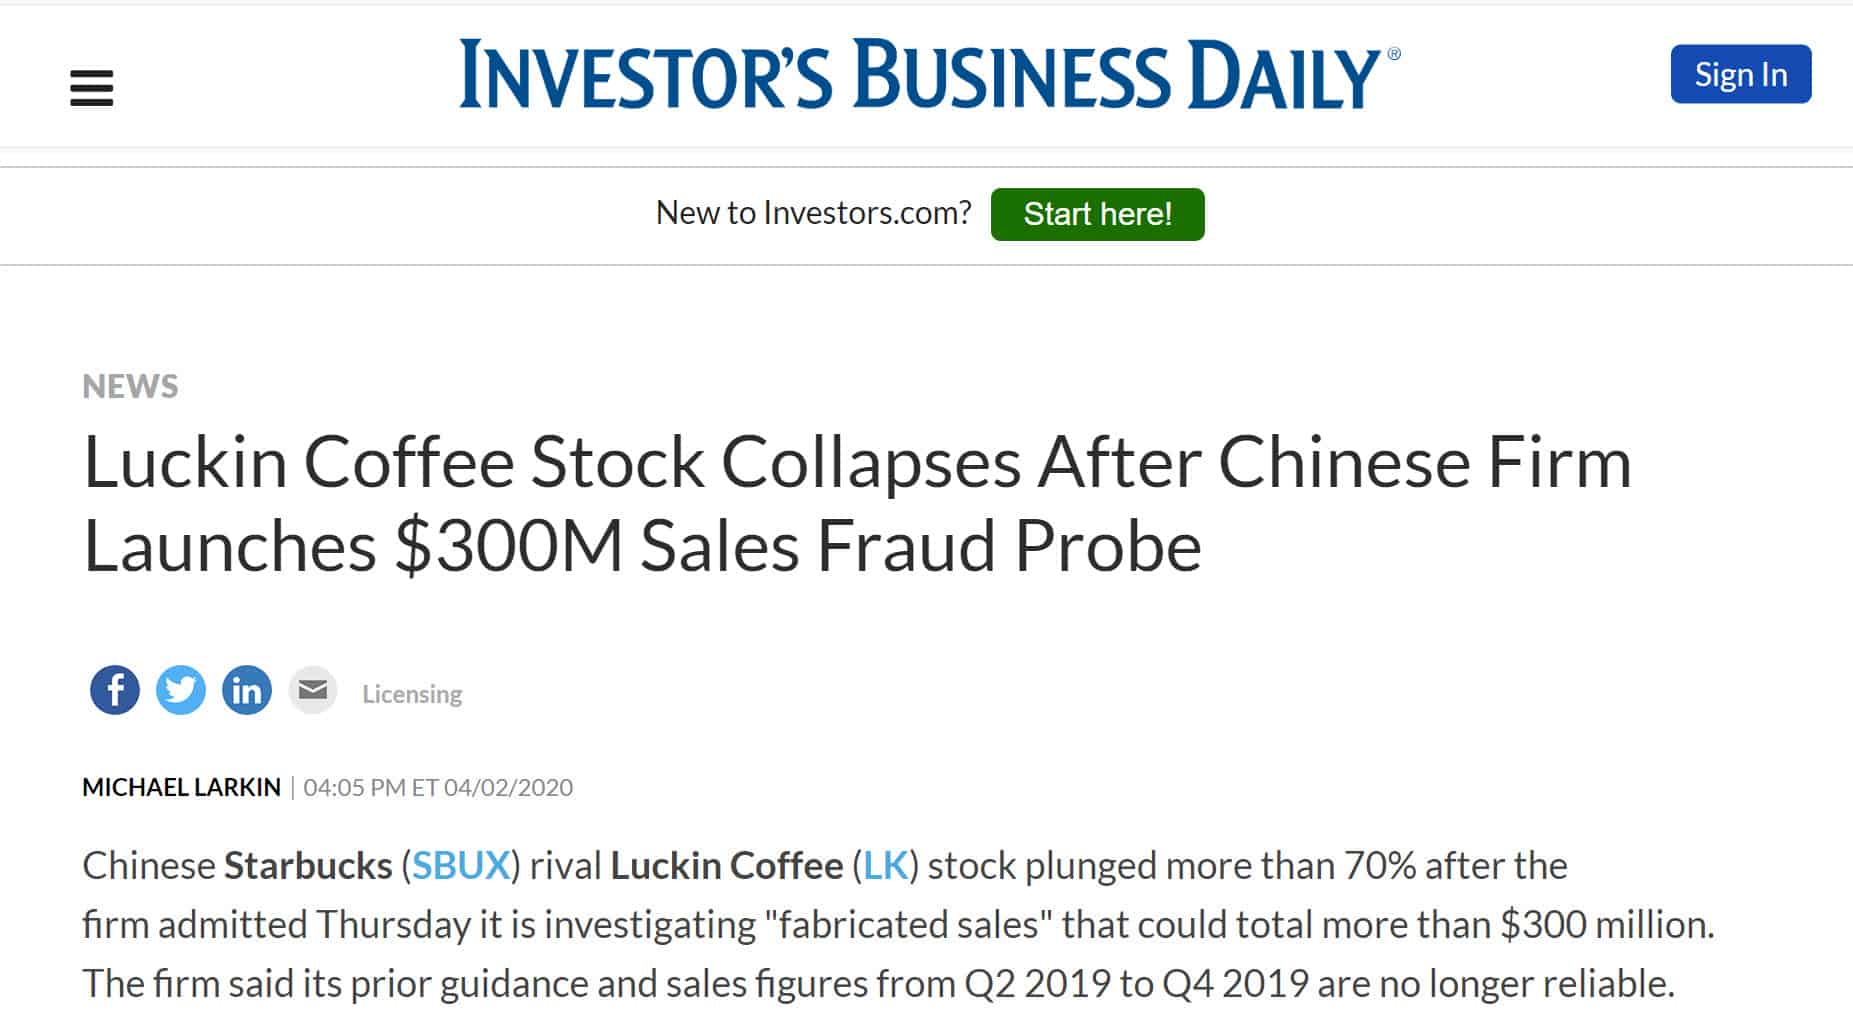
Logically, the same strategy can be applied to an individual stock. Negative news can also cause the crash of an individual stock. For example, when the world came to know Luckin Coffee published fraudulent sales figures, the company’s stock prices experienced a sudden, dramatic 80% fall in one day time!
On the other hand, positive news can also be an important trigger. When the economy is thriving, the stock market is often also booming. If a company publishes wonderful figures, there is a big chance the company’s stock price will rise. On average, the prices increase less quickly on good news than they fall on bad news.
Profit from volatility
Being an investor at Plus500, the good news is you can profit from volatility or price movements. Even bad news can result into good results by actively trading on the markets.
Plus500 namely makes it possible to go short. This means you can bet on falling prices. Crashing markets might result into wonderful and positive results when you decide to invest at Plus500.
But how do you exactly decide when it is the best time to open an investment? In the rest of this comprehensive Plus500 manual, we will discuss how you can time your trades appropriately.
Part 3: Market & horizontal levels
Now you know the ins and outs of the Plus500 software, we can further investigate how to select the best investments. This part of the Plus500 tutorial will tell you all about how to best invest considering different market circumstances. To achieve the best investment approach the following steps have to be taken
Determining the trend
The Plus500 graphs can be zoomed in and out. You can also adjust the period the graph displays. Within the 1-minute graph for example each period is exactly one minute, while in the 1-week graph each period is one week. Longer periods can be very handy to predict future price patterns.
On every timescale you can always see the market situation. Study the rates at a somewhat larger period to determine the general trend, there are three possible market conditions:
- Uptrend: the price is mainly moving up; you’re looking for the right time to buy.
- Downtrend: the price is mainly moving down; you’re looking for the right time to sell.
- Consolidation: the price is moving between two points; there is no specific trend at this time.
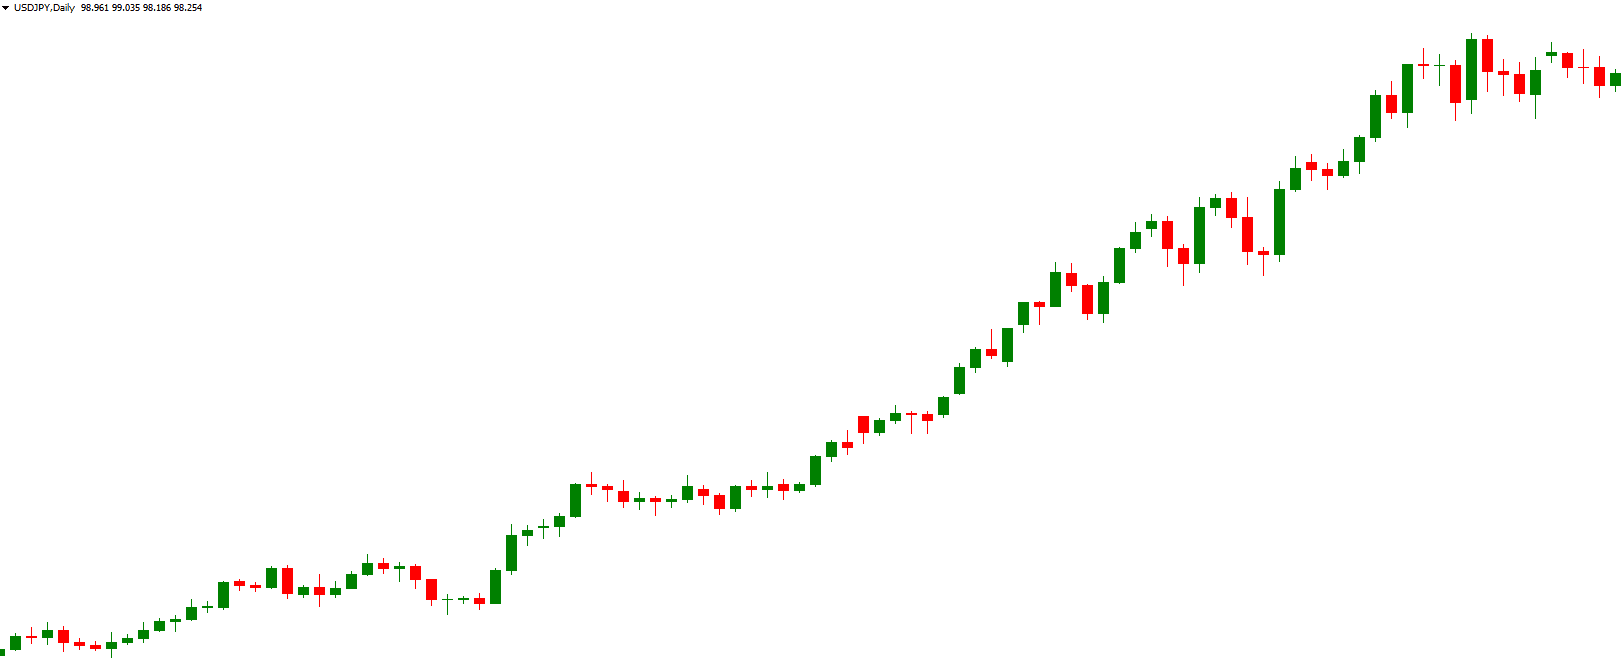
Example of a clear uptrend
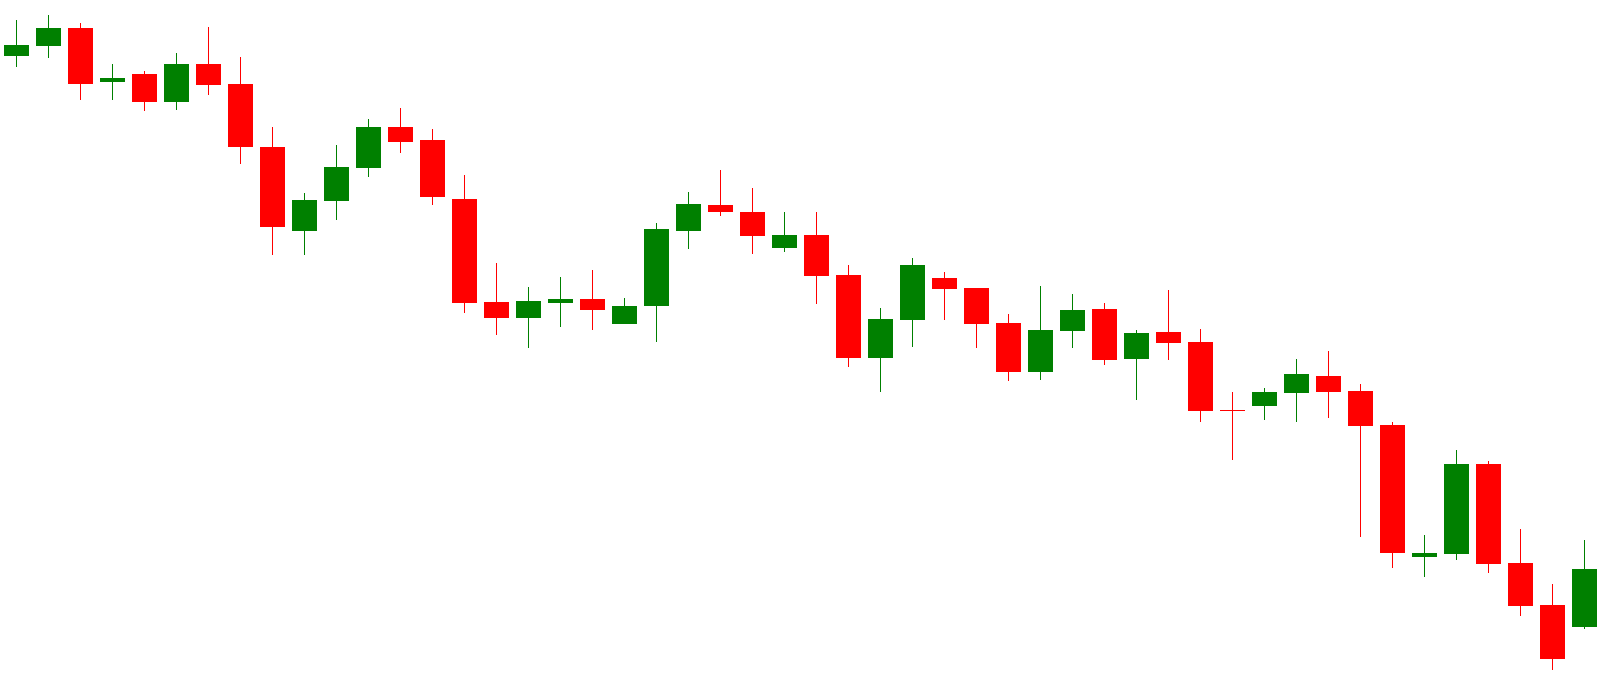
Example of a clear downtrend
Trading with trends
When the market has a clear trend, it is important to trade with the direction of the trend. When you notice that the price is going up within the Plus500 software, you should buy; and when you see the price is going down, you should sell. It is important that you do not open a position randomly!
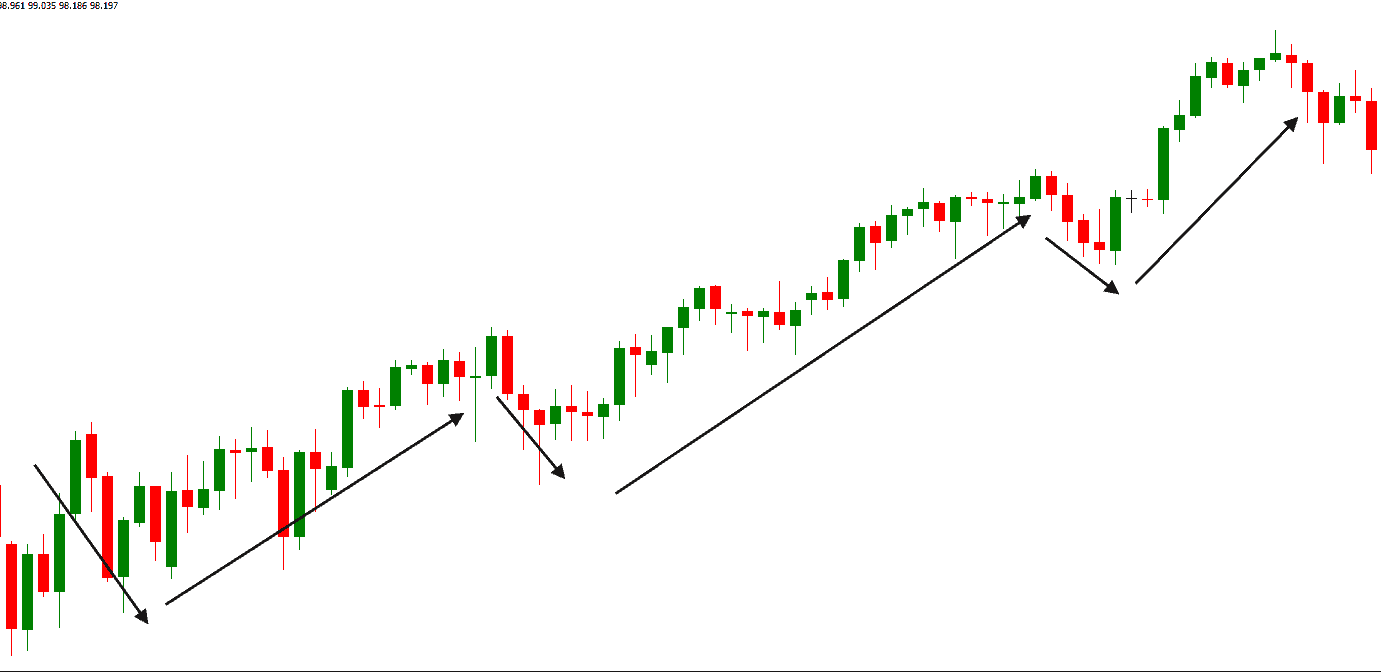
It is better to find a technical reason to open up a position. When there is a trend, the price moves in the direction of the trend. We call this an impulse. After the impulse the price drops a bit, the retracement.
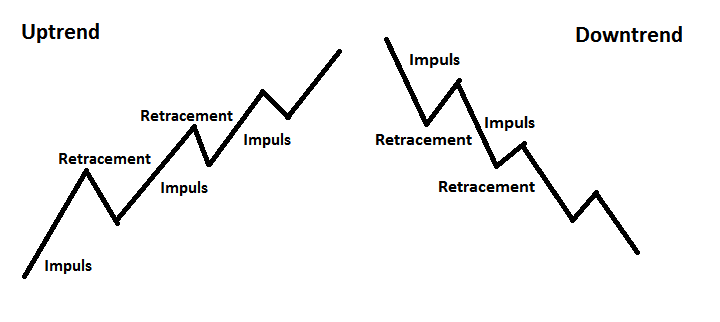
The chance of success is at its highest when we open up a position right after the retracement. We buy in an uptrend in a temporary move down and in a downtrend we sell right after a temporary move up. You can use this trading style until there is a case of a trend reversal, which is when a new trend forms in the opposite direction.
Recognizing horizontal levels
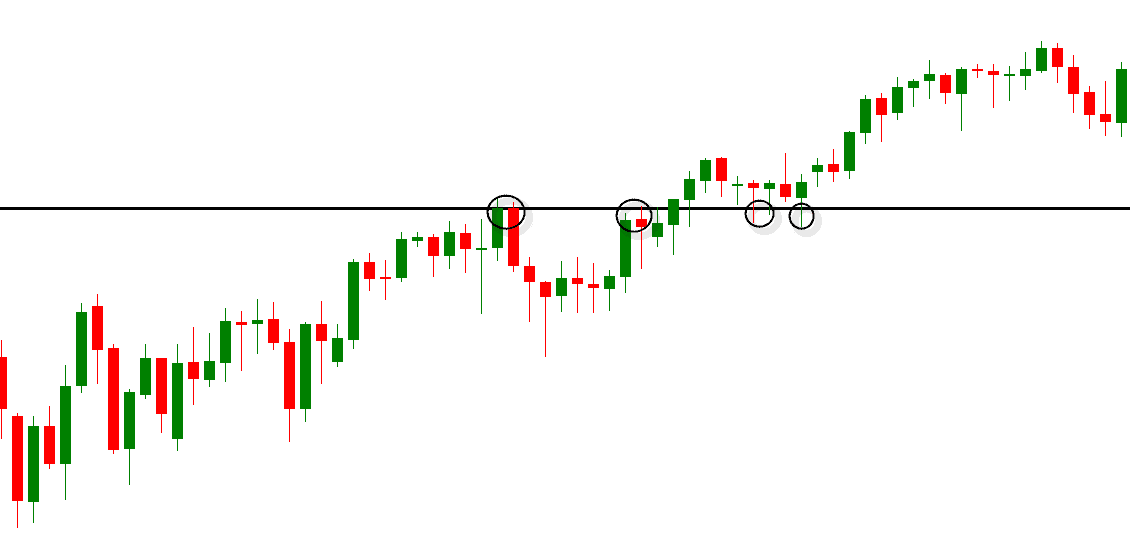
But how do you time a trade? To time a trade properly, you need to look for horizontal levels. A horizontal level is a level the price reaches multiple times but doesn’t seem to go past. A lower horizontal level in an uptrend is what we call support and a higher horizontal level in a downtrend is what we call resistance.
The Plus500 software also allows you to draw horizontal levels. To activate this feature, use the third icon at the top of your graph.

By opening your position on a horizontal level, you increase your chance of making a successful trade. As almost everyone expects the price to move in a certain direction at this point, this happens a lot at that specific level! This is why horizontal levels, which are in effect for longer periods of time, are a lot more powerful than a level which is reached only a few times.
It can also occur that the role of a horizontal level changes after a break-out. A resistance can become support or vice versa. This is very handy because you can see if there’s renewed action when this level is reached again.
Special situation: consolidation
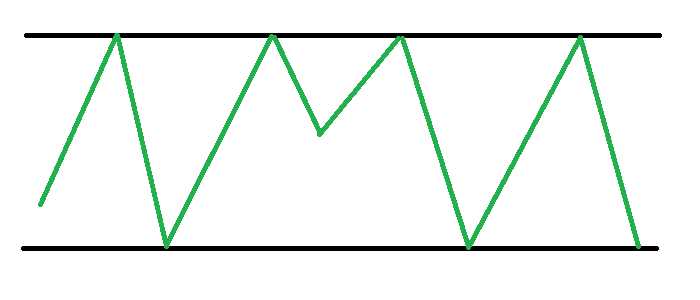
Besides the uptrend and downtrend, a consolidation is also a possible scenario. In the case of a consolidation, the price fluctuates between two horizontal levels. In a consolidation it is best to buy at the lower horizontal levels and sell at the higher horizontal levels.
Consolidation: buy low, sell high
Part 4: price action & the right timing
The next part of the Plus500 investment tutorial will tell you all about how to use candlesticks to achieve better results.
Working with candles
A line within a chart doesn’t give you a lot of information. That is why good traders would rather use candles. With candles, you can determine the so-called price action, which gives you an indication of possible further movement. Within the software of Plus500, you can easily switch to candles by pressing the button shown below.

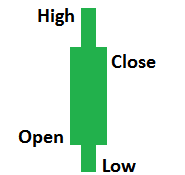 A candlestick always applies to a certain period. A candlestick can for example show the price movements over the course of a trading day. A candle has a body that is colourized and a stick that sticks out.
The colour of the body indicates if the market is going up or down. Red shows if the price closed lower and green shows if the price closed higher.
The stick shows what the reach of the price was within that period; how high or low did the price go?
Candles explained: clear trend
These candles can indicate a clear trend.
The high test / low test
 On the left you see a high test; it is marked with a long stick above the body (a minimum of 2/3). A low test is the opposite; you’ll find the body on top and the stick is long and pointing down. The colour isn’t relevant with the high and low tests.
The high and low tests are both strong price indicators. They reflect the switch of buyers to sellers and vice versa. At the high test the price was pushed up significantly, but the buyers were too weak and the price came back down. This is a strong sell signal and, vice versa, the low test is a strong buy signal.
Train tracks and twin towers
 The train tracks consist of two (nearly) identical bars next to each other, first a green one and then a red one. With the twin towers it is the opposite, a red bar is intersected by an almost identical green bar. This combination can be seen as a merged high or low test; the two bars together form a failed break-out.
The train tracks are a strong sell signal because the sellers take over from the buyers. The twin towers is the opposite and can therefore be seen as a strong signal to buy.
Bullish / bearish engulfing bar
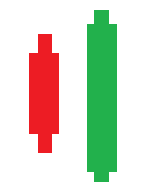 The bullish engulfing bar is a dropping bar followed by a rising bar that both surpass the bar at the bottom and the top. After the initial drop, the price kept rising; many sellers joined the party and this level couldn’t be maintained. The price dropped and the low of the previous bar was also breached; this is a strong signal to buy.
Vice versa, the bearish engulfing bar is a strong sell signal. The rise is followed by a much stronger drop where both high and low surpass the previous bar.
Candles explained: indecisive
These candles can indicate there is no clear trend.
Inside bars
 The inside bars are a strong indicator of indecisiveness. The inside bar fits into the previous bar; thus there is no clear direction. The double inside bars are even stronger. Here the third bar fits within the second bar. After double inside bars, a strong movement down or up is to be expected.
Doji bars
 The doji bar sends out a strong signal of indecisiveness. The doji bar is almost symmetrical in the centre where the price went up or down. Within that period there wasn’t a lot of action.
When to invest?
The information provided in this tutorial can help you to make trades with a higher return on investment potential. When you take a position on a horizontal level there is an increased chance you make a beneficial trade. When you take a position based on the candlesticks we have discussed in this manual, you are also more likely to determine the right timing for your trade.
The strongest investments are opened when all indicators are aligned. Do you for example acknowledge an upward trend? In that case, you have the greatest chance on success when the price moves back to a resistance level. When you see a candlestick at this level indicating a continuous upward trend, this can be the right moment to open a trade.
Please be aware, being a profitable investor doesn’t automatically mean you always have to be right. If you manage to find the perfect risk-return balance, regular failure might still result into an overall positive result.
Would you like to learn more about investing?
You have now mastered the basics of technical analysis. These basics give you a clear advantage over newbie Plus500 investors. Moreover, you can even enhance your results by using technical indicators. You can read more about technical indicators by reading our technical analysis course. Use the below button to immediately browse to the course:
Start trading now!
You now know a lot more than other beginning traders. Do not forget that trading is not about intelligence; it is about managing and dealing with risks. Make sure you earn more on a winning trade than you lose on a losing trade.
Another thing to keep in mind is that you need to look for the gathering of factors. Do you have a good price action on a strong horizontal level? Take that position! Be prepared to sometimes lose because you can’t always win. The prices cannot be predicted with a 100% certainty. Therefore, always use a stop loss!
Do you want to become an even better trader? Then it is time to start practising! Did you not open an account yet? Use this button to open a free demo account with Plus500:

